

Usage & Cost
Monitor usage, compare activity across projects and models, and investigate changes in spend.
Use Usage and Cost to see how your team uses Bunyan, track consumption over time, and identify the projects, models, or API keys behind a change in spend.
Dashboard Overview
Open Usage and Cost from the sidebar. Start with Summary for an overview, or select APIs, Models, Flows, RAGs, or Deployments to focus on a category. Deployment metrics are available in an organization workspace.
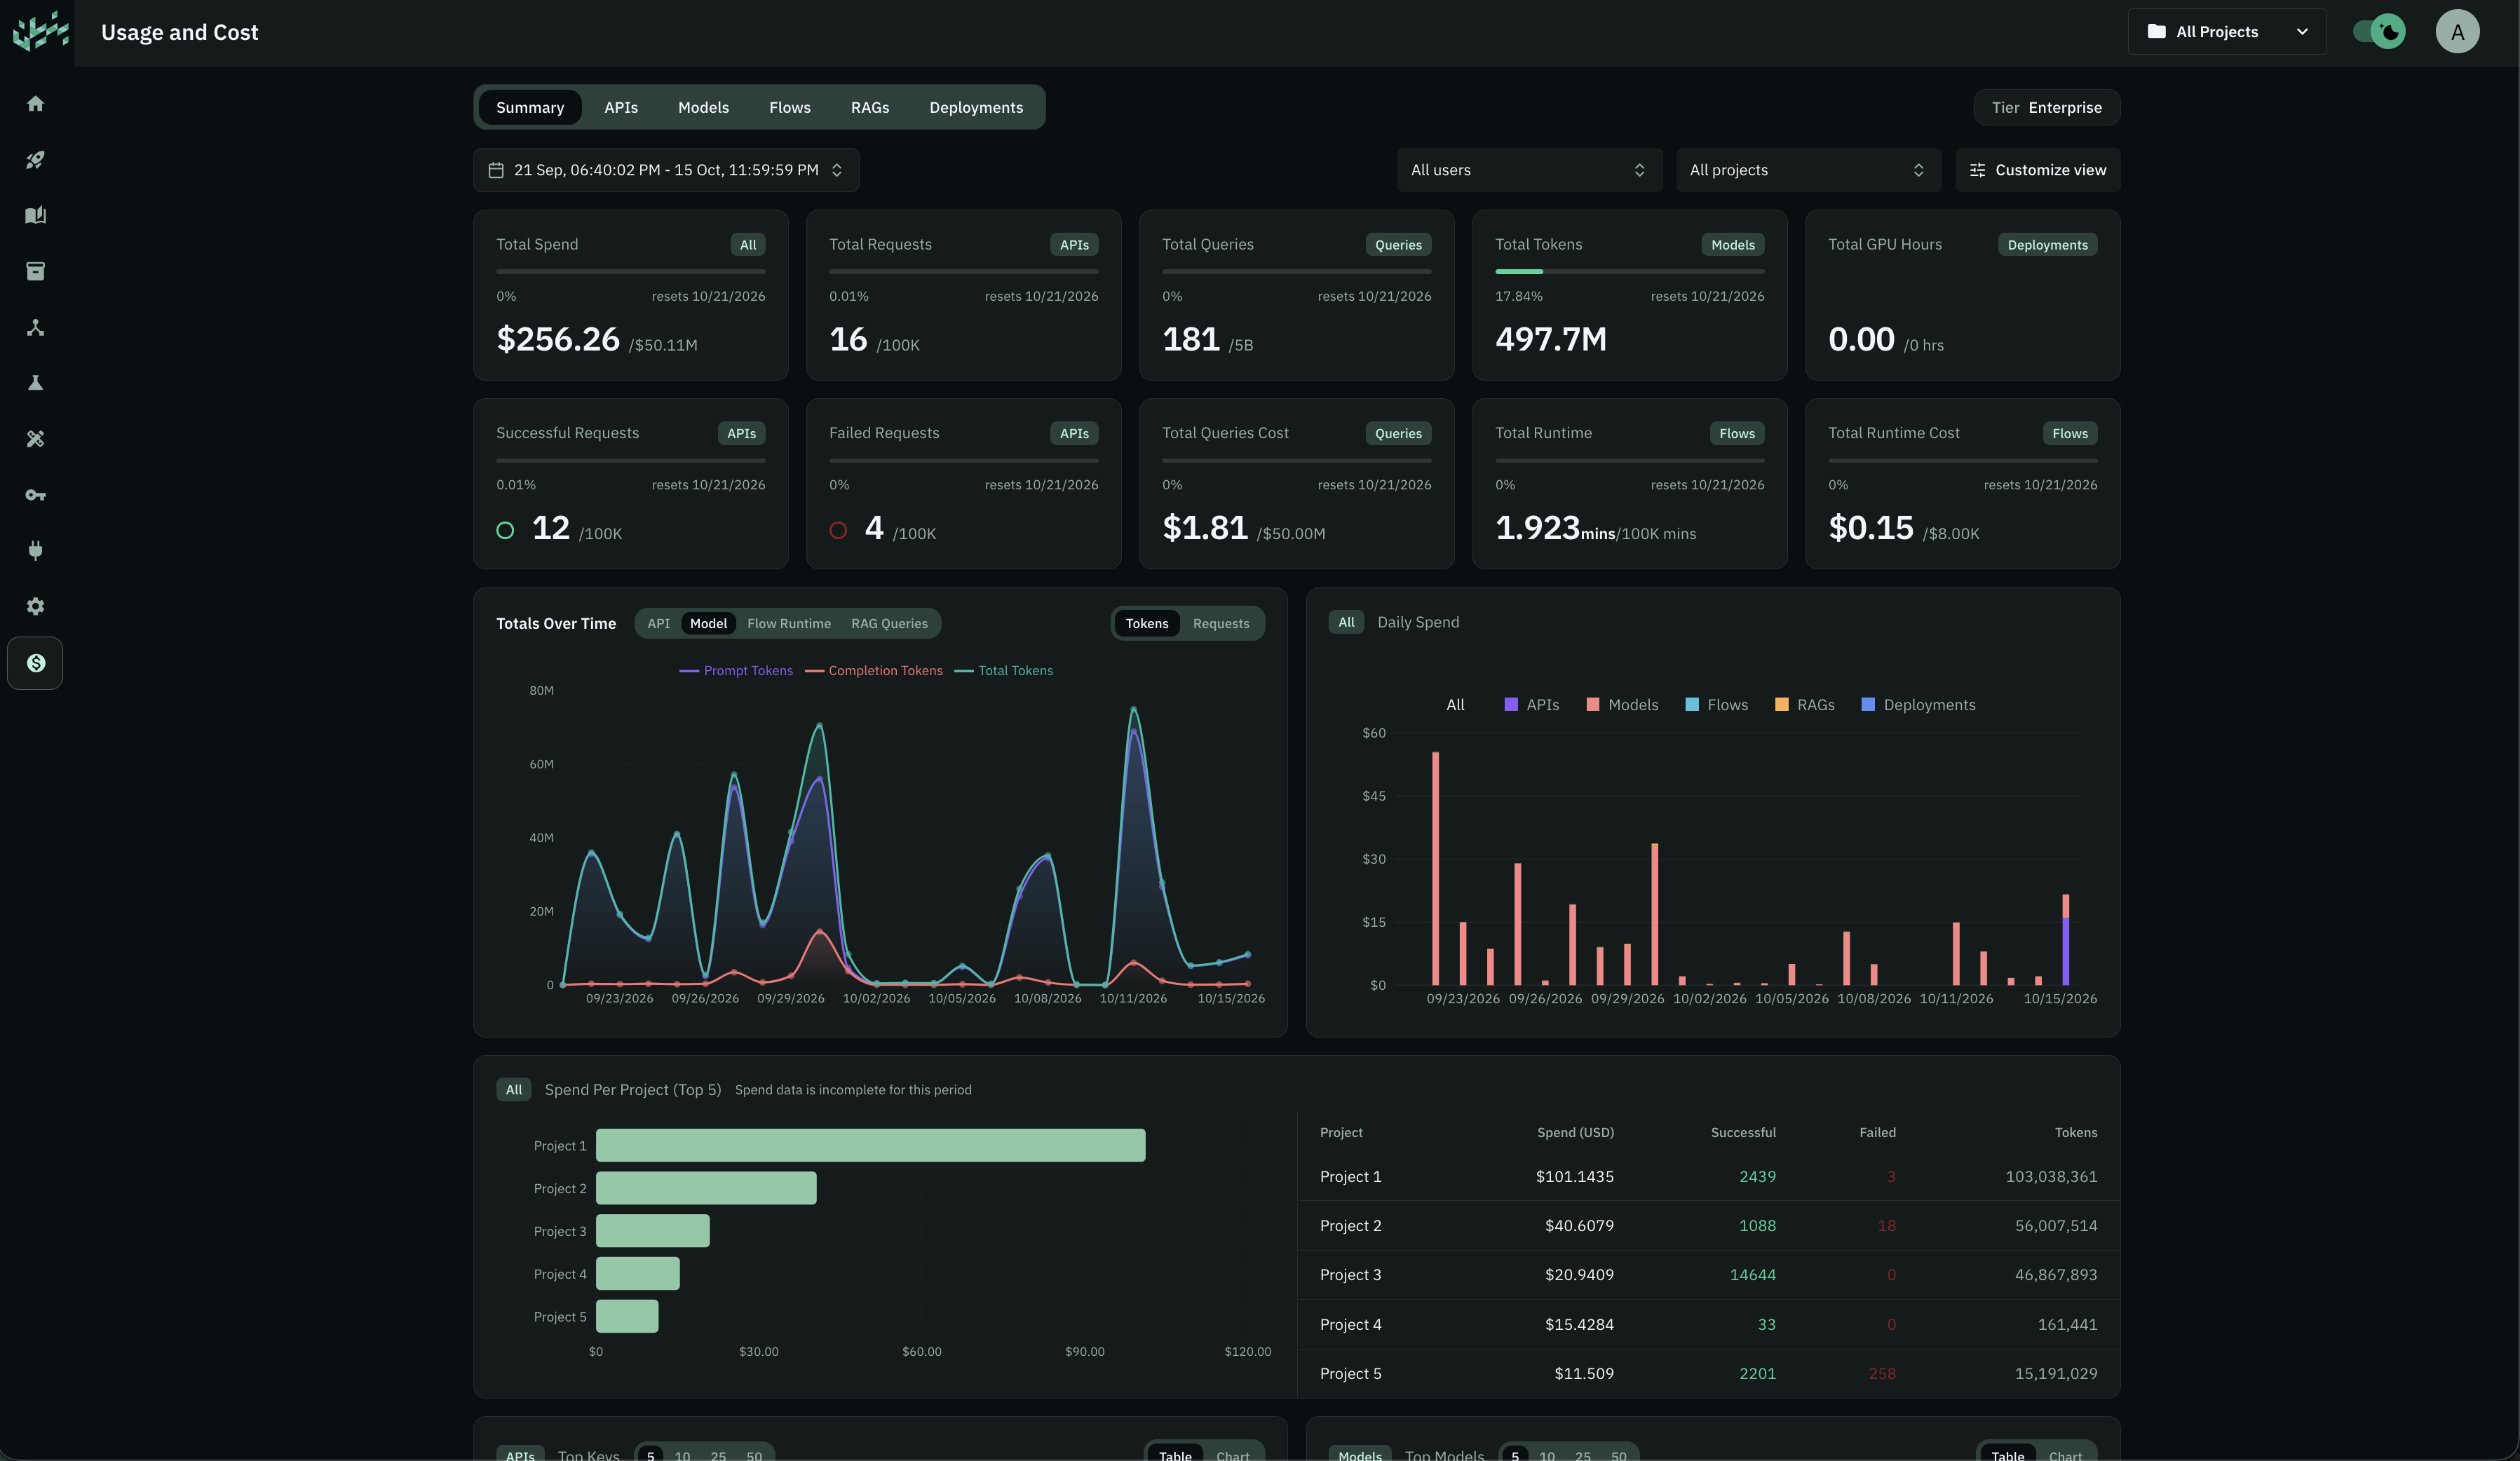
The summary brings together:
| Metric | What it helps you track |
|---|---|
| Total Spend | The spend reported for the current view. |
| Total Requests, Successful Requests, Failed Requests | API activity and request outcomes. |
| Total Tokens | Model token consumption. |
| Total Queries and Total Queries Cost | RAG query activity and its reported cost. |
| Total Runtime and Total Runtime Cost | Flow execution time and its reported cost. |
| Total GPU Hours | Deployment compute usage. |
Read each metric with its displayed unit and any plan limit or reset date shown alongside it.
Filter the Dashboard
- Select the date range. Choose a preset, such as Last 7 days, or select start and end dates. Adjust the start and end times when you need a narrower window.
- In an organization workspace, use All projects to choose a project or review activity across projects.
- Organization owners can also use All users to focus on one member.
- Choose a category to show its relevant metrics and breakdowns.
Check the selected date range and any reset dates shown on the cards before comparing usage. If a panel reports incomplete spend data, treat that breakdown as partial when comparing it with other totals.
Usage Breakdown
Compare Activity Over Time
Use Totals Over Time to find peaks in activity. Switch between API requests, model usage, flow runtime, and RAG queries. For models, compare prompt tokens, completion tokens, and total tokens, or switch to request counts.
Use Daily Spend alongside the activity chart to identify when spend changed. Keep the same date range and filters when comparing results.
Find the Projects and API Keys Behind Usage
Spend Per Project (Top 5) compares the leading projects and includes successful requests, failed requests, and token counts. Select a project in the dashboard filter to investigate it further.
Under APIs, review Top Keys to compare API keys by calls and reported spend. Where a breakdown offers Table and Chart, switch views to compare values or spot larger contributors.
By Model
Under Models, review Top Models and the model configuration table. Search for a model, filter by provider, source, or type, and sort the table by model, type, or request count. Provider Usage offers a broader comparison across providers.
By GPU Hours
Under Deployments, compare Total GPU Hours with Top GPU Hours to identify the deployments using the most compute.
Workflow Executions
Under Flows, review total runtime and Top Flows to compare execution counts, runtime, and reported spend.
Cost Optimization Tips
- Investigate a spike by narrowing the date range, then checking the relevant project, API key, model, or deployment.
- Compare prompt and completion tokens to understand which part of a model interaction drives consumption.
- Review failed requests when activity rises unexpectedly.
- Schedule inference uptime around when you need your deployments.